Projects Healthcare Revenue Recovery
Giving an AR Team One Place to Track and Resolve Claims
An Accounts Receivable module built into Spectrum Health Solutions' patient system. It gives the AR team one place to track claims, talk to insurers, and recover stuck revenue, instead of running a spreadsheet alongside the real system.
- Company
- Spectrum Health Solutions
- Timeline
- 2023
- Role
- Product Designer, team of 5
- Scope
- IA, UX, analytics dashboard, design system
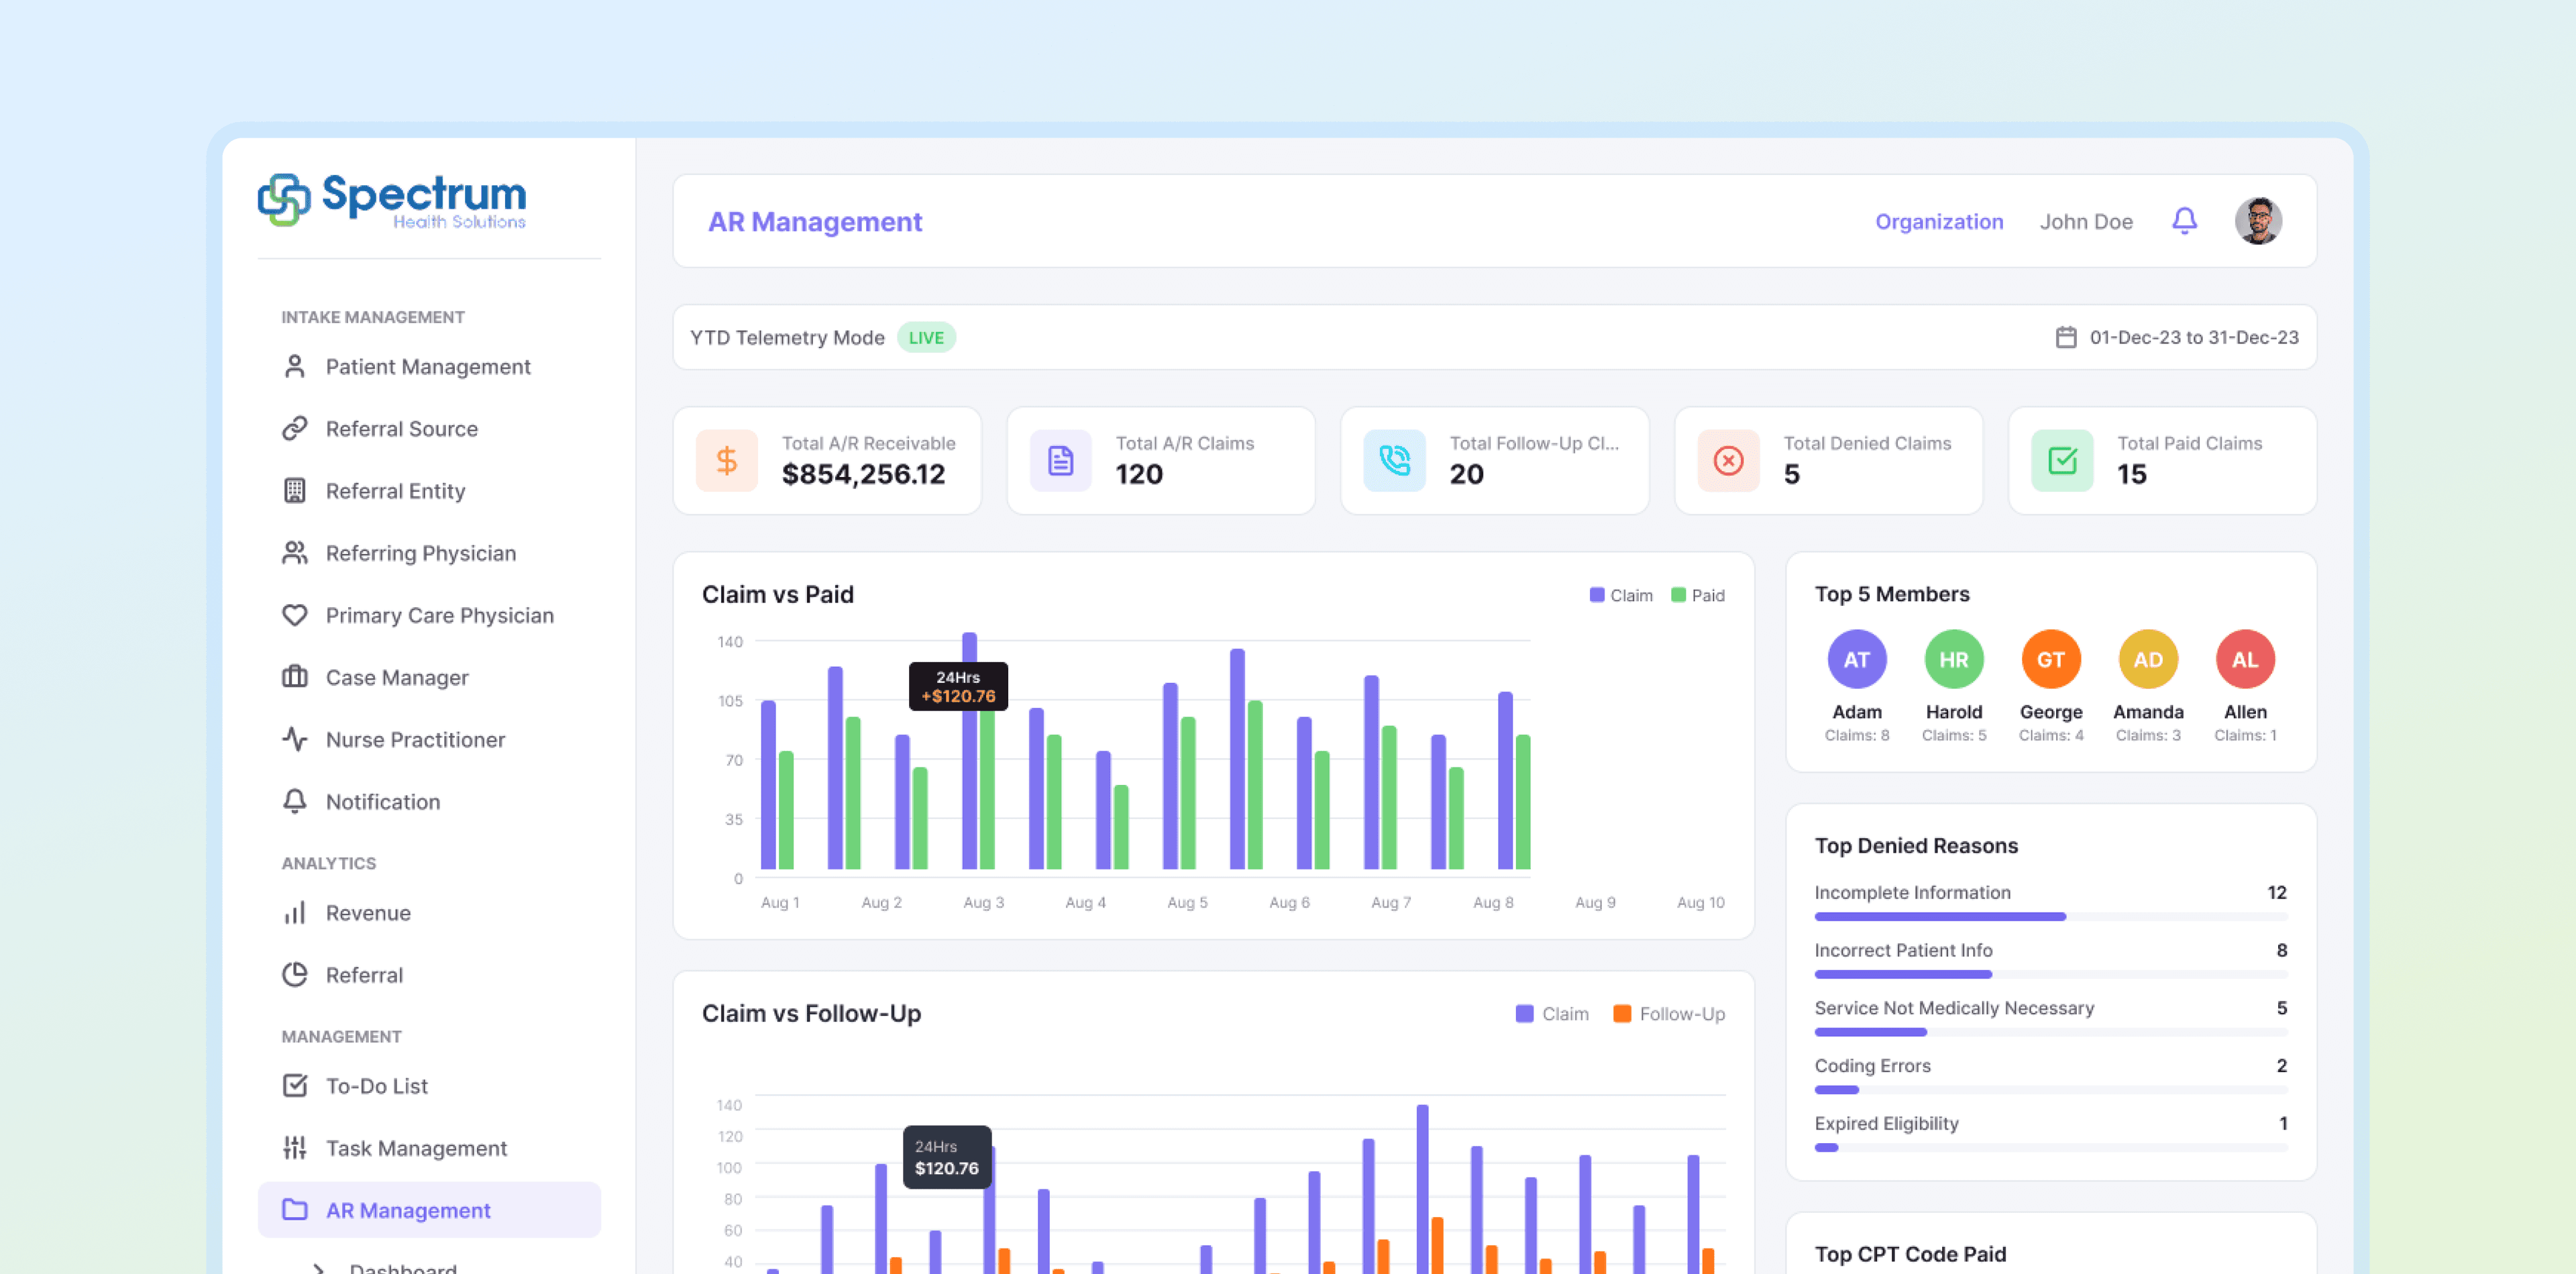
WHAT AR MANAGEMENT REPLACES
Instead of a spreadsheet living outside the real system, one module where every charge, insurer call, and rejection reason lives with the claim itself.
5
aging buckets, from 0-30 days to 120+, driving triage
80%
of pending claims recovered after launch
Analytics
detailed trends and rollups, built for high-level and detail-oriented decisions alike
Built for the Team Standing Between a Claim and Its Revenue
- Who
- The internal AR team at Spectrum Health Solutions, who chase down stalled insurance claims for healthcare providers. And the providers themselves, whose revenue depends on those claims getting paid.
- Why
- Claims stalled at insurers with no single place to see what was needed to resolve them. About 80% sat untouched, because the data to act on them lived in a spreadsheet, not the system where the work happened.
- What
- An AR Management module added directly into the existing patient system: charge tracking by age, one consolidated claim view, and an analytics dashboard, replacing the Excel workflow running alongside it.
How the AR Team Actually Worked a Claim
Before designing anything, I watched AR specialists work their existing spreadsheet-and-system routine, sat in on insurer calls, and talked to the practice owners waiting on that revenue.
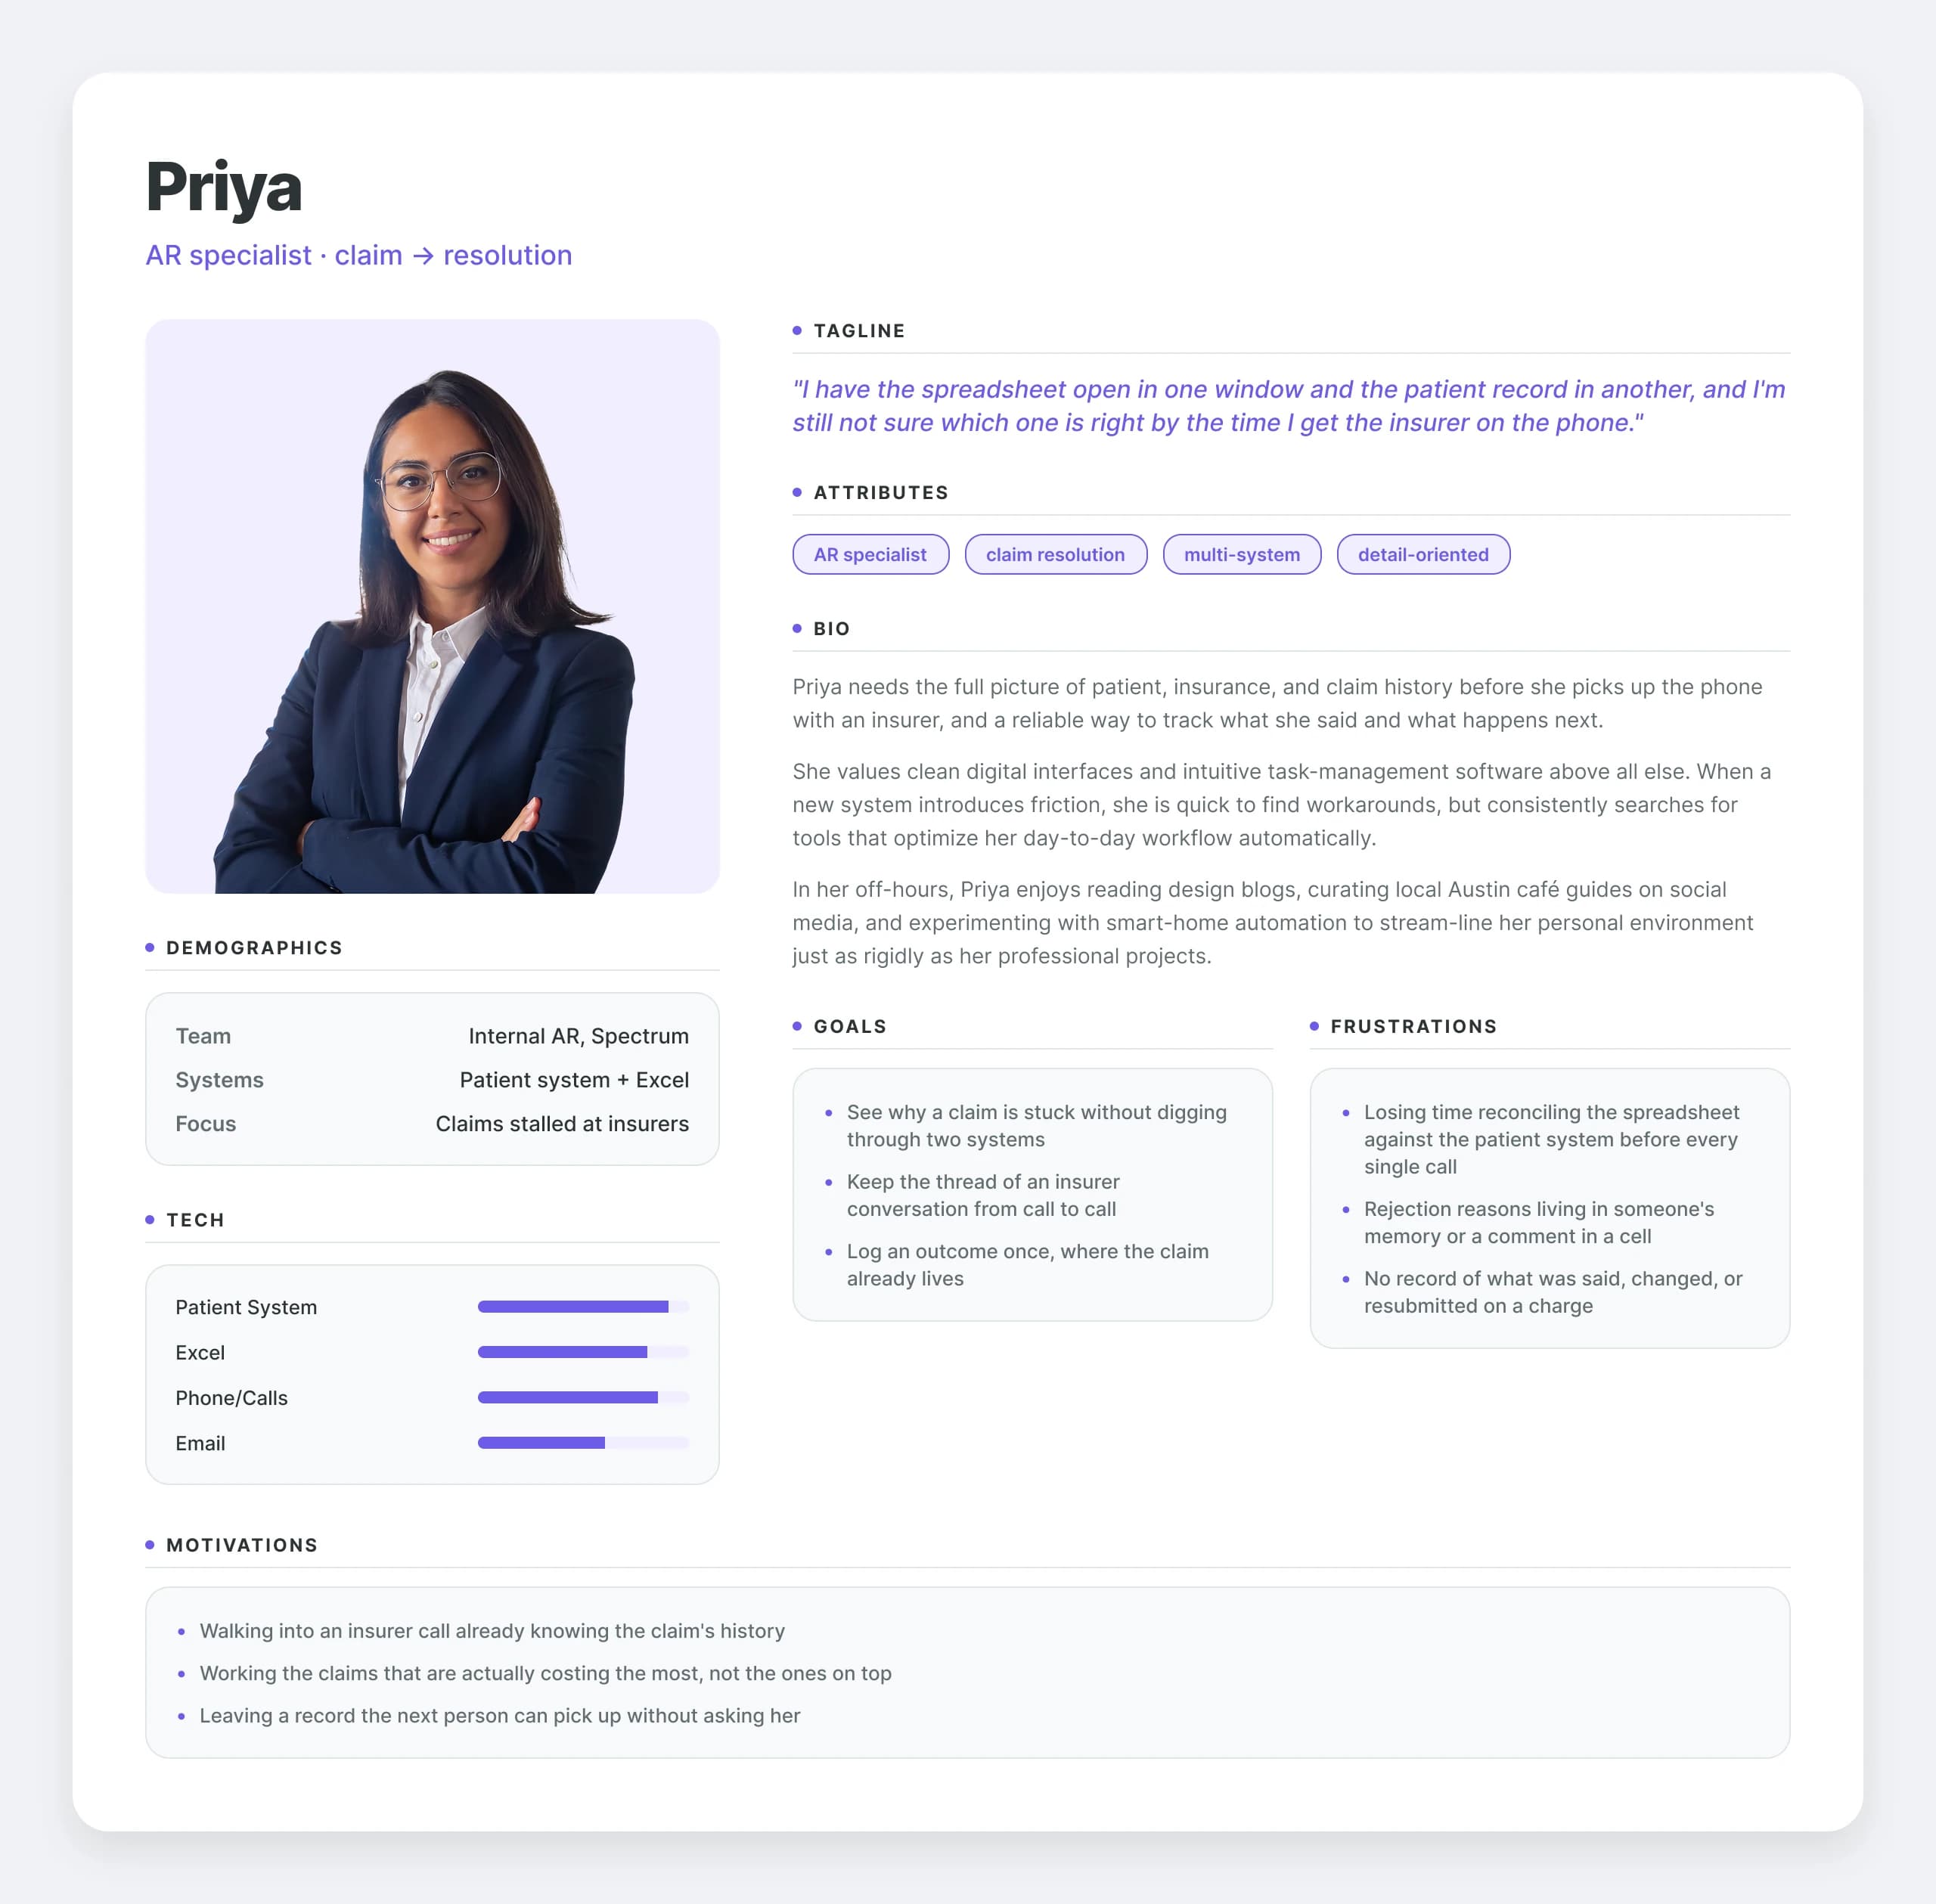
WHO A CLAIM PASSES THROUGH
2 personas
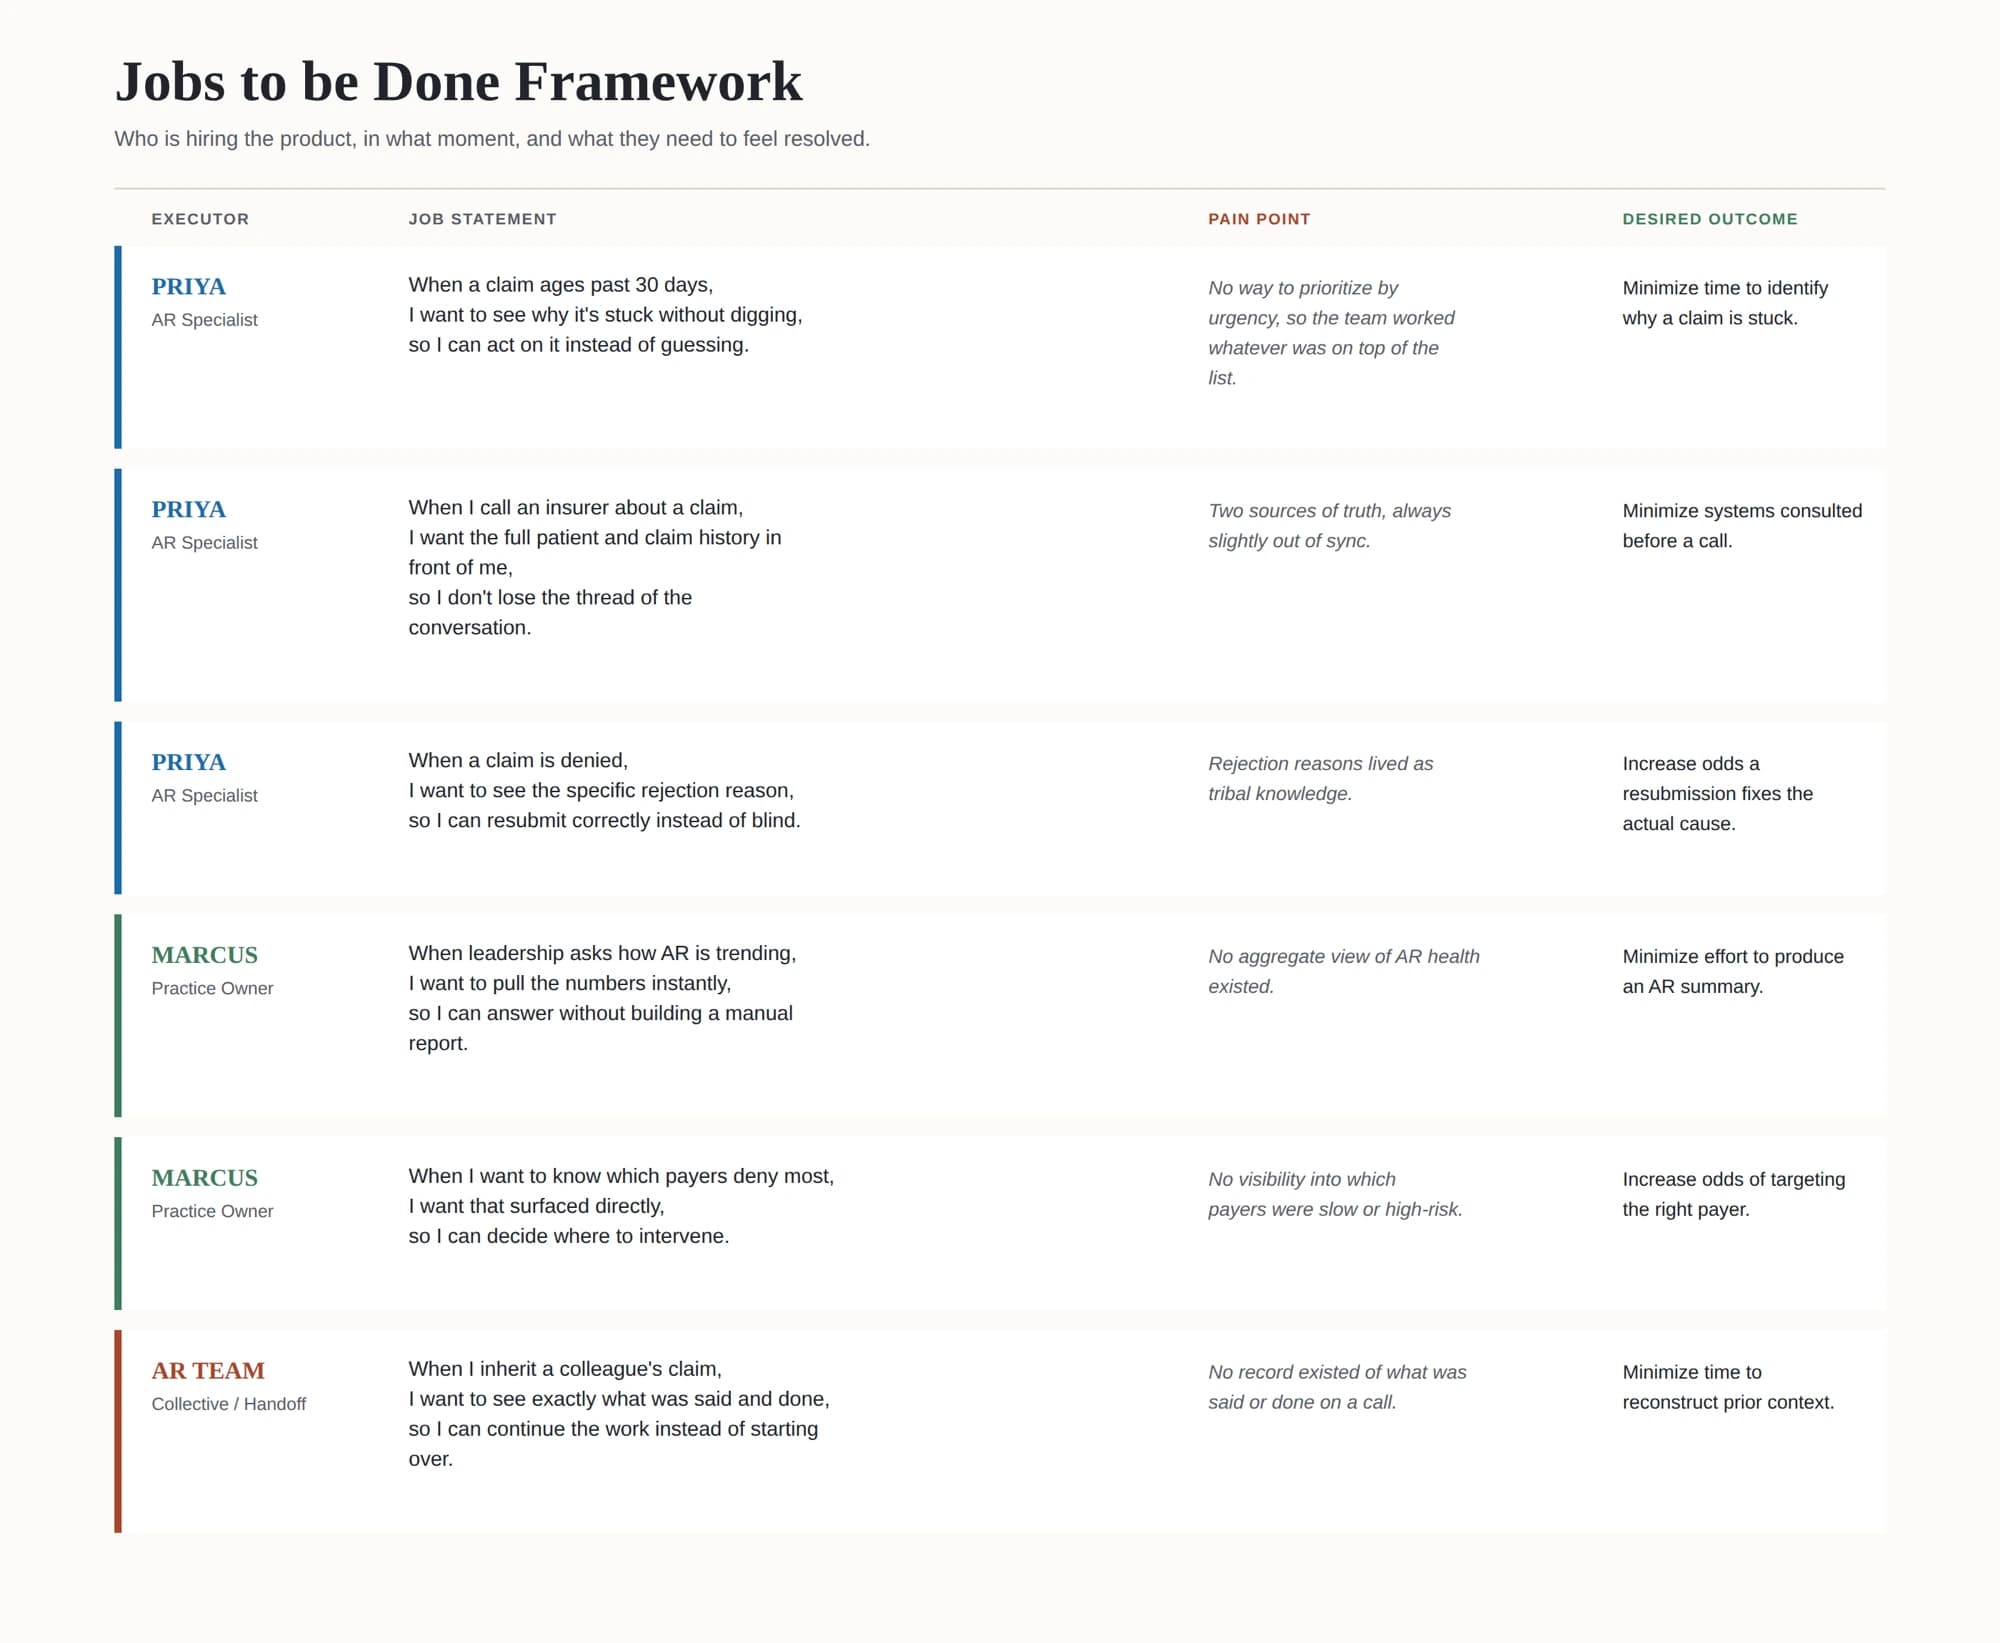
Same pattern each time: when this happens, I want to do this, so I get that outcome, whether it's Priya resolving a claim, Marcus checking AR health, or a handoff between the two.
Before · Excel + system
- 01Open Excel to check which claims are aging and by how much.
- 02Check the patient system separately for visit and insurance details.
- 03Call the insurer without a record of prior rejection reasons or notes.
- 04Manually update the spreadsheet with whatever happened on the call.
- 05Leadership requests an AR summary. Someone rebuilds it from scratch.
After · AR Management
- 01Open the Charge List, already sorted into aging buckets.
- 02Open the charge: insurance, payment, and visit details are already together.
- 03Call the insurer with prior status history and rejection reasons visible.
- 04Log the outcome directly on the charge. Follow-up date sets itself.
- 05Leadership opens the Analytics Dashboard. The numbers are already there.
Claims Stuck at the Insurer, Revenue Stuck With Them
Spectrum Health Solutions' AR team is the last step between a patient visit and the revenue it should bring in. When a claim stalled at an insurer, the specialist resolving it needed the full picture in one place: patient details, visit history, past claim status, rejection reasons.
They didn't have it. The patient system held the clinical and billing record; claim status, follow-up dates, and notes lived in spreadsheets updated by hand. Every insurer call meant checking two sources first. With no single view of what was aging and why, nearly 80% of pending claims sat unresolved, revenue already earned but uncollected.
PROBLEM STATEMENT
Claim data lived in Excel. The actual work happened in the patient system. So nothing about a claim's status, history, or urgency was ever in one place.
Discovery with the internal AR team and review of the parallel Excel-based workflow.
IA and UX for charge tracking, aging buckets, and claim-status workflows.
Detailed charge view consolidating insurance, patient, and payment data.
Analytics dashboard design for claims, denials, follow-ups, and payer trends.
“I have the spreadsheet open in one window and the patient record in another, and I'm still not sure which one is right by the time I get the insurer on the phone.”
A Workflow Split Across Two Systems That Never Agreed
Talking to the AR team surfaced the same few breakdowns, again and again, each one a direct cause of stalled revenue.
Two sources of truth, always slightly out of sync
The patient system held the clinical and billing record. Claim status, follow-up dates, and notes lived in Excel, kept current by whoever last remembered to.
No way to prioritize by urgency
Without aging visibility, the team worked whatever was on top of the list, not the oldest or highest-value claims first.
Rejection reasons were tribal knowledge
Why a claim was denied lived in someone's memory or a cell comment, not somewhere the next person touching that charge could find it.
No record of what was said or done
A call to an insurer, a resubmission, a status change, none of it was logged anywhere a teammate or manager could review later.
Leadership had no visibility into AR health
No aggregate view of total outstanding, denial rates, or slow payers existed. Every question meant someone manually pulling numbers from the spreadsheet.
THE GUIDING QUESTION
What if the AR team's data and their actions lived in the same tool the rest of the business already trusted?
Six Decisions That Moved AR Into One System
Each decision closed a specific gap between where the data lived and where the work actually happened.
Built AR Management as a native module inside the patient system, not a parallel tool.
Splitting data and action across two tools meant the team was always reconciling instead of working.
Charge list bucketed by aging, 0-14 through 120+ days, so the team triages oldest-first.
Working claims in no particular order meant the oldest, highest-risk revenue kept slipping further behind.
Every charge opens into one detail page with insurance, payment, and visit data together.
A call to the insurer required piecing together patient, insurance, and claim history from multiple screens.
Added status-based claim processing that tracks each stage and the specific rejection reason.
Rejection reasons and claim stages existed only in memory or scattered notes.
Added a comment and status history on every charge, so any teammate can see what happened and when.
No record existed of what was said, changed, or decided on a charge.
Built an Analytics Dashboard as a real module, surfacing denial trends, aging totals, and CPT-level revenue.
Leadership had no visibility into AR health, and kept requesting numbers no one could produce without hand-building a report.
One Charge, From Aging Bucket to Resolution
An AR specialist doesn't hunt for what to work on next. The system surfaces it, and every action taken is recorded against the charge itself.
Charge Tracking, Follow-Up, and Analytics as One Module
Every screen exists to answer one of three questions: what needs attention now, what happened on this charge, and how is the whole book of AR trending.
Every charge is grouped by how long it's been outstanding, 0-14 through 120+ days, so the team works the oldest, highest-risk claims first, not whatever a spreadsheet happened to have open. Opening a charge shows patient, visit, insurance, and payment details plus a full status history together, so an insurer call starts already informed.
Charge List & Aging Buckets
Every charge is sorted into an aging bucket the moment it's created, filterable by bucket, status, or insurer, so the team always knows what's oldest and most at risk.
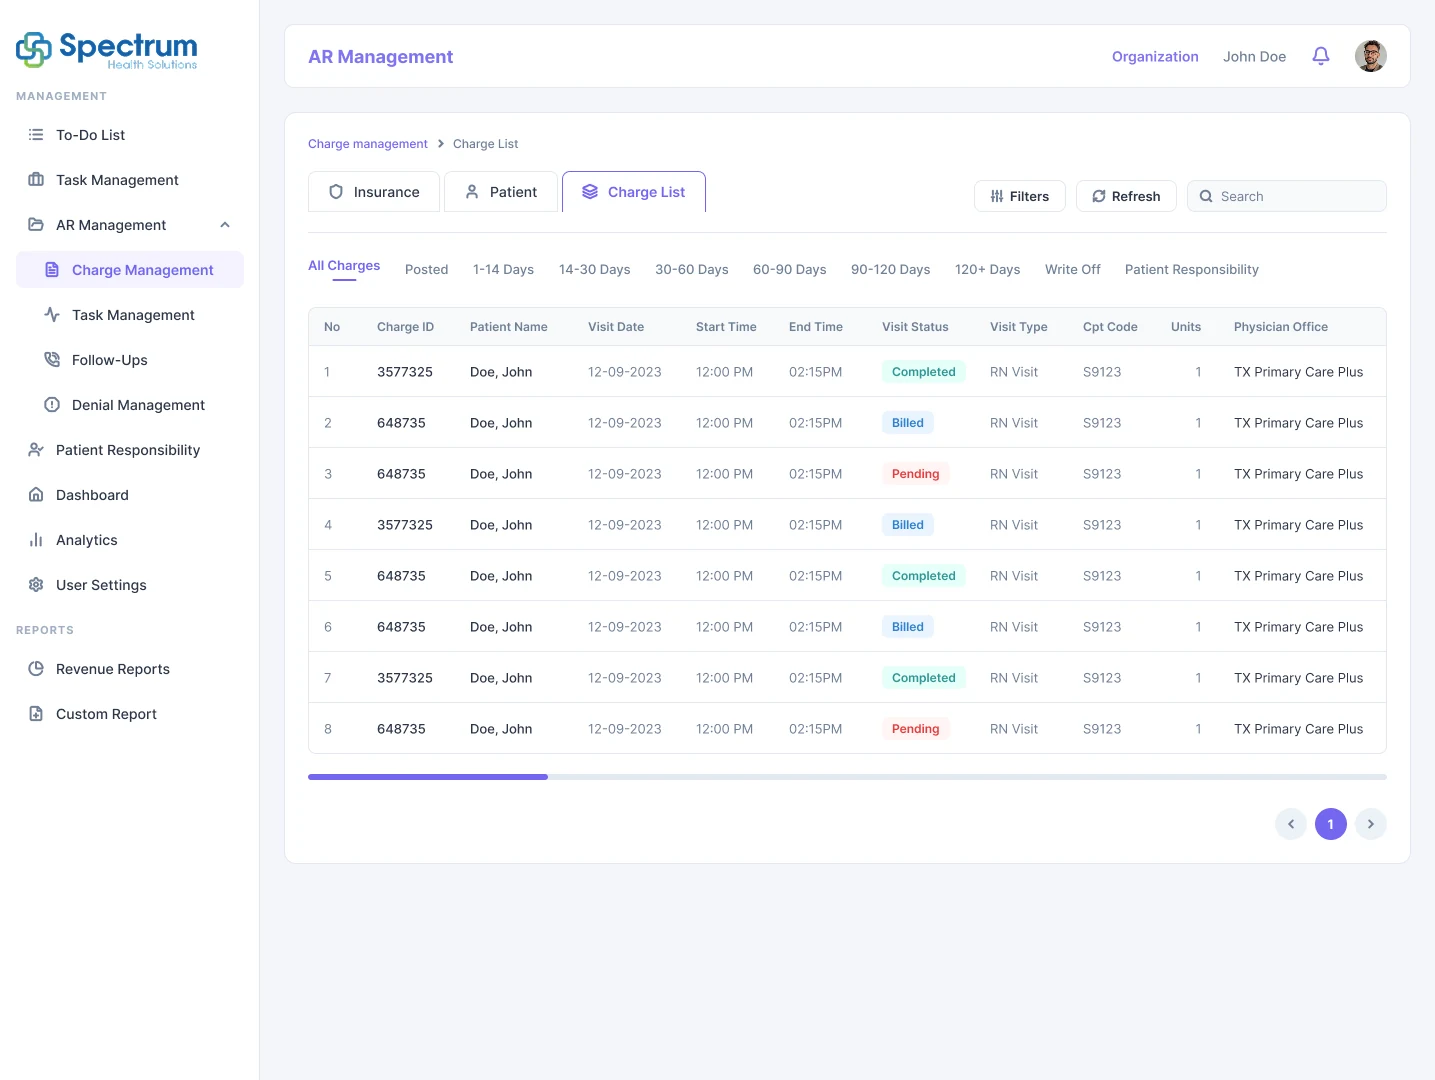
Early versions listed all charges in one flat table sorted by date created. It didn't surface urgency, so aging buckets became the primary way to slice the list.
The team could work oldest-and-highest-risk claims first instead of whatever was visible, directly shrinking the backlog of aged claims.
Charge Details
Opening a charge shows everything a specialist needs before calling an insurer: insurance, payment and patient balances, visit info, and a full status and comment history.
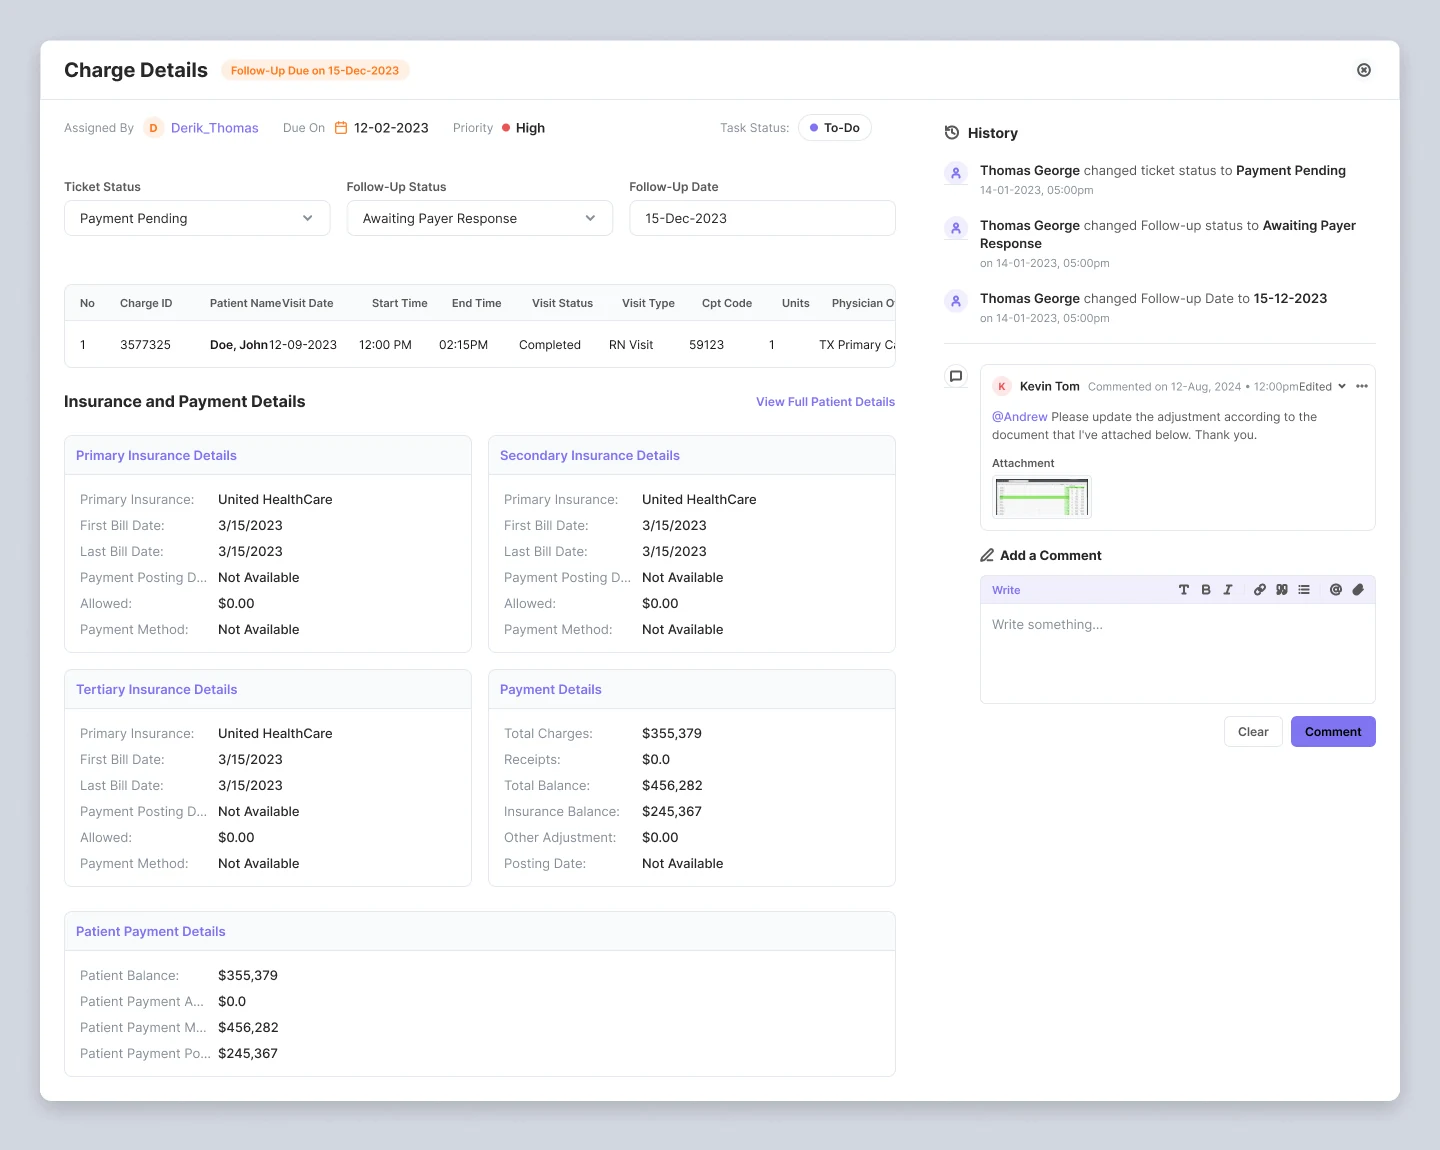
Insurance, payment, and history were originally three separate tabs. Watching specialists flip between them mid-call with an insurer drove consolidating it into one page.
Specialists walked into insurer calls already informed, cutting the back-and-forth that used to stall a follow-up call.
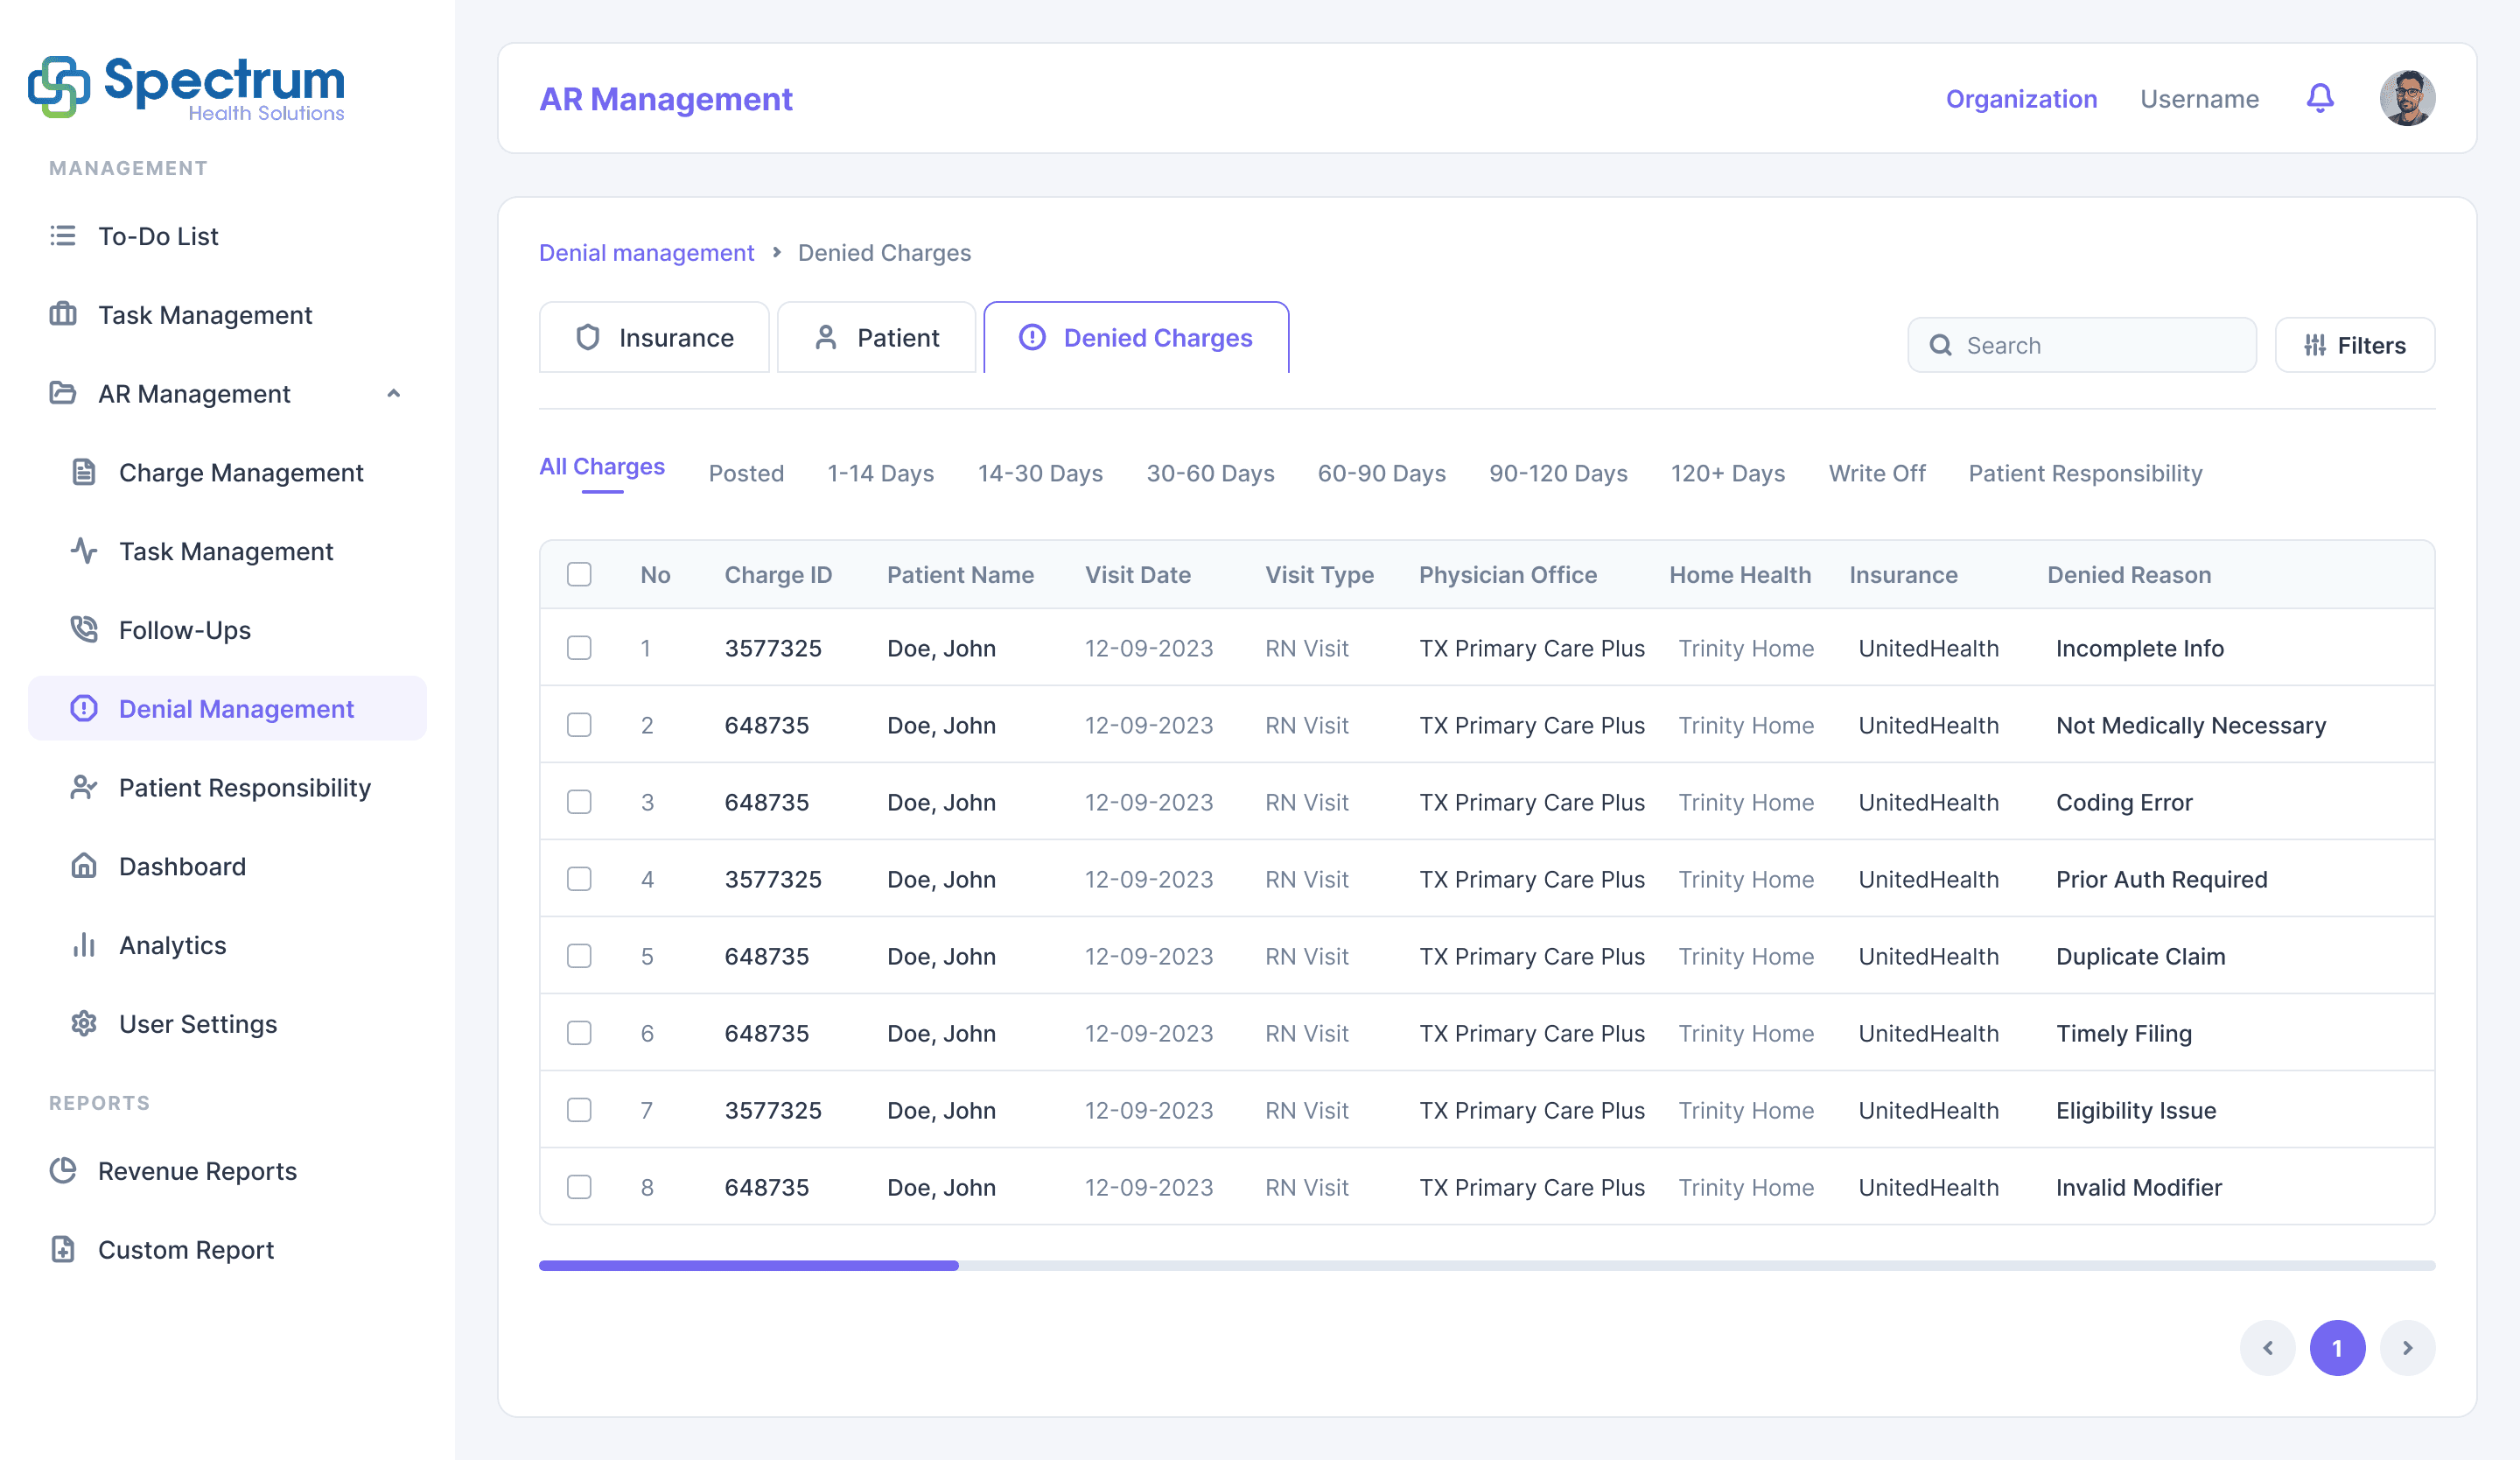
Denial Management
Denied claims are tracked with the exact rejection reason, missing information, incorrect patient info, coding errors, expired eligibility, so the team fixes the actual cause instead of resubmitting blind.
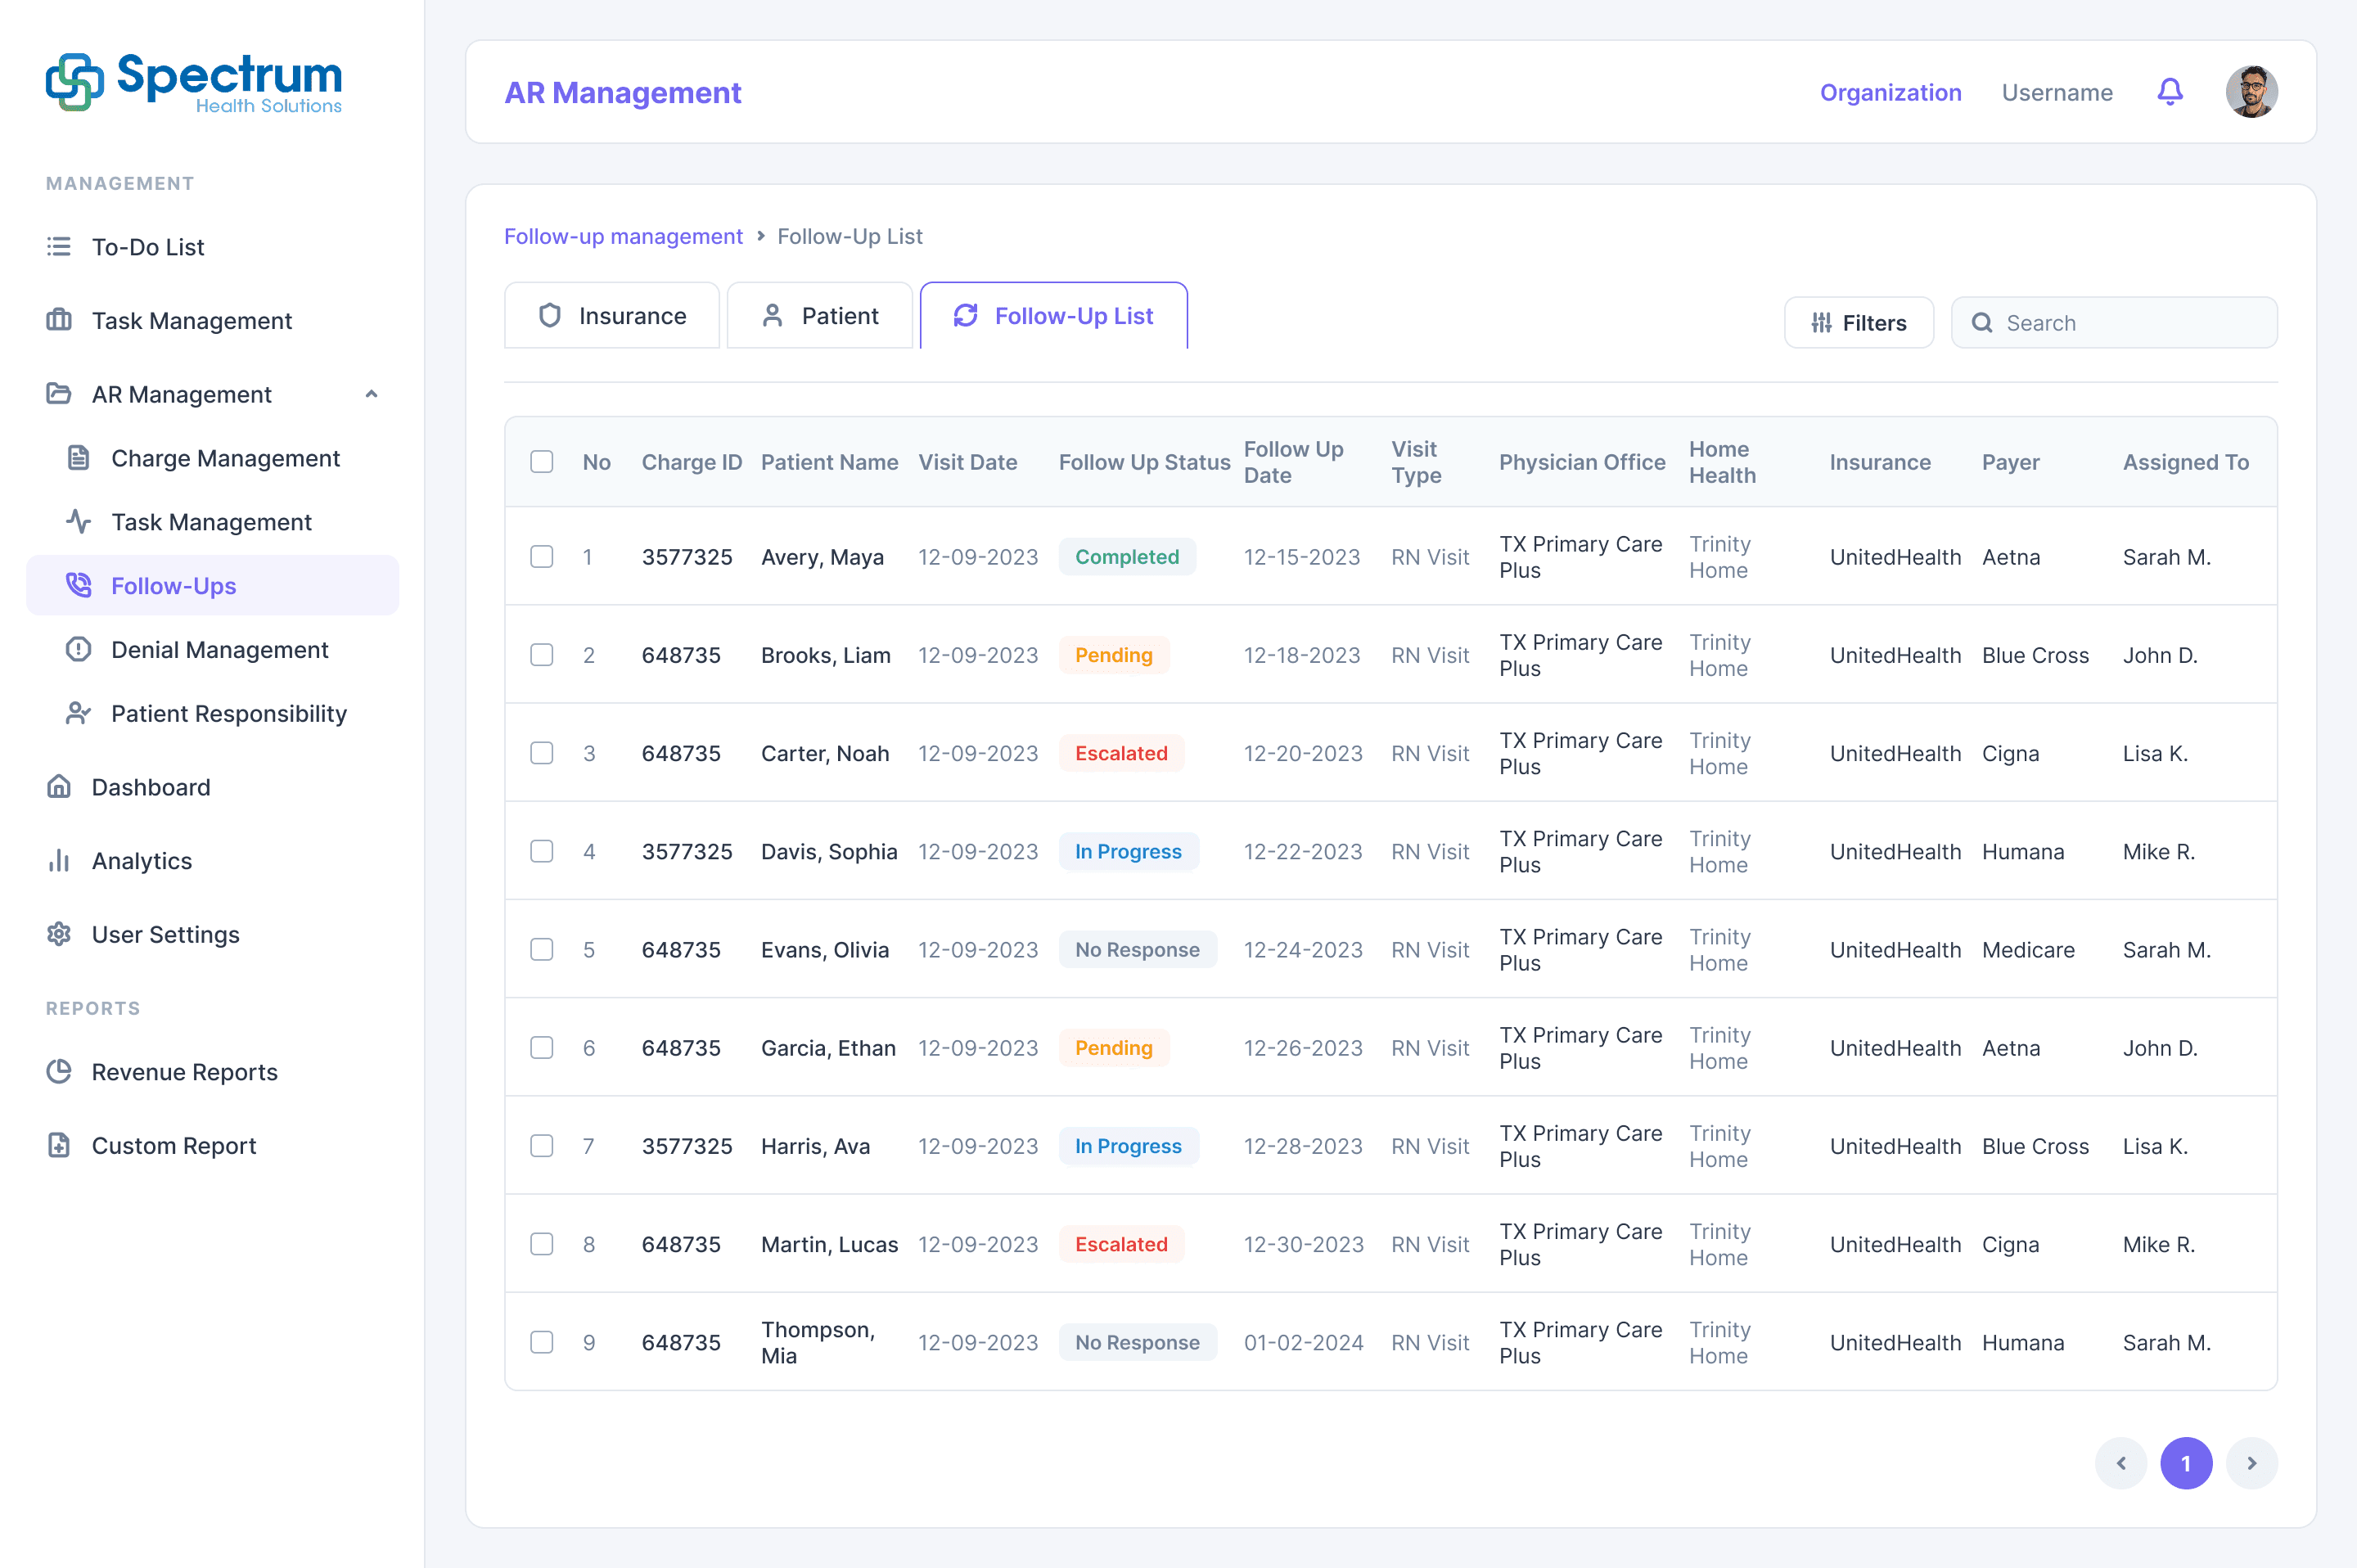
Follow-Ups & Task Management
Follow-up dates and to-dos are tracked per charge and surface as due-on-date notifications, so nothing waiting on an insurer gets forgotten.
Analytics Dashboard
The most important screen in the product: claim vs. paid, denial, and follow-up trends, total AR outstanding, top denial reasons, top CPT codes paid, and which payers deny most, all in one actionable view.
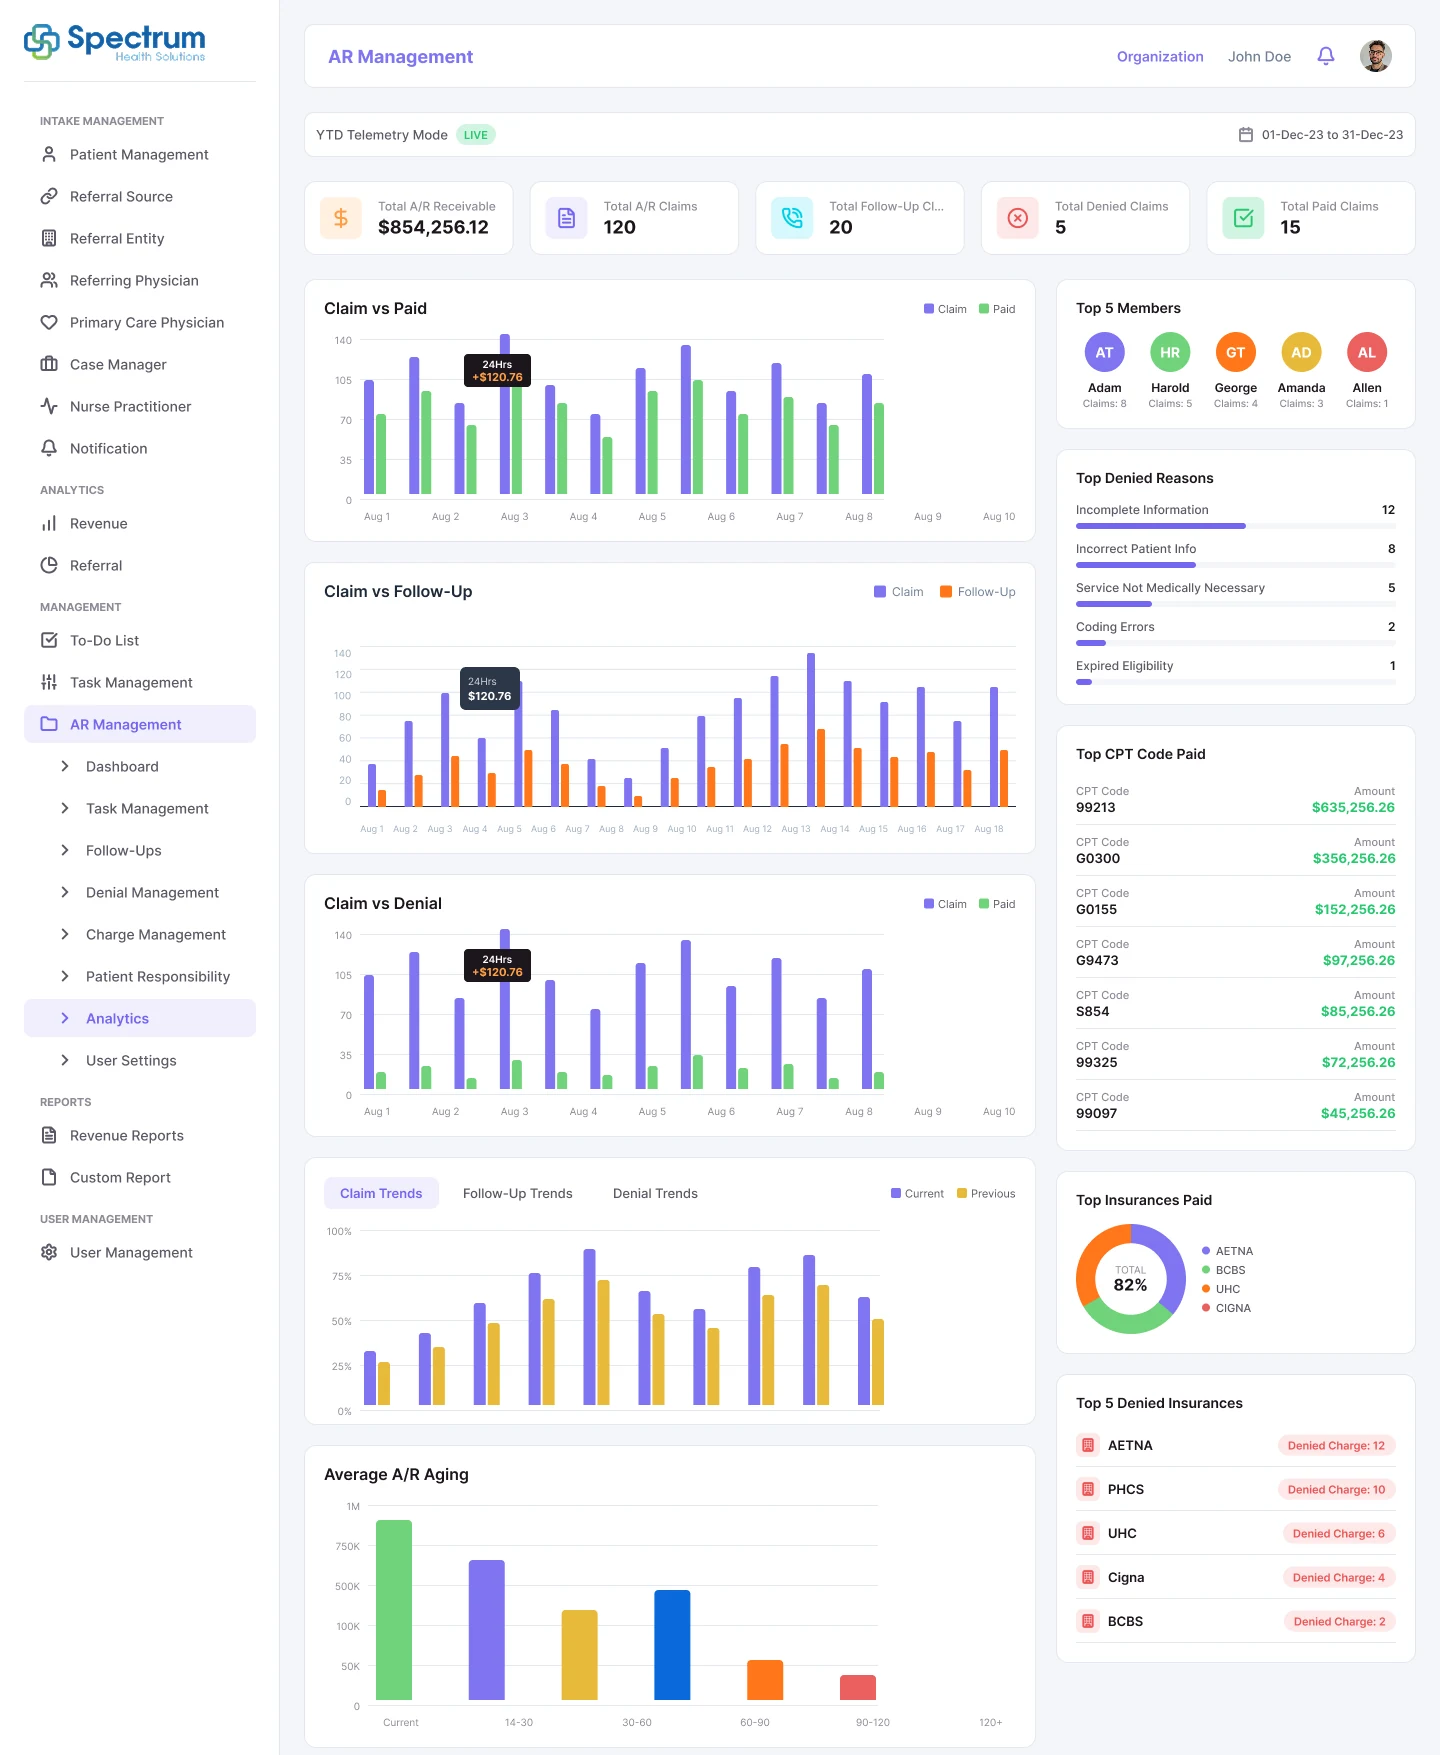
Analytics wasn't in the original scope, it came from leadership repeatedly asking for numbers no one could produce without working the spreadsheet by hand. Once built, it became the module leadership opened most, so it kept growing: payer-level denial trends and top CPT/insurance breakdowns were added after launch.
The clearest line to revenue in the product. Showing which payers deny most and why turned denial management from reactive to targeted, and gave leadership a live view of AR health instead of a monthly manual pull, the single biggest reason behind the 80% recovery number.
Detail vs. speed
A charge page rich enough for any insurer question risks becoming slow to scan for a routine follow-up.
Structure vs. flexibility
A fixed claim-status pipeline keeps reporting consistent, but not every payer's process maps cleanly onto it.
Automation vs. accountability
Automating reminders and bucket movement reduces manual tracking, but the team still needs a clear record of who did what.
One System for AR, and the Revenue It Recovered
~80% of pending claims recovered
Consolidated visibility and aging-based triage moved previously stuck claims through to resolution.
AR health, visible for the first time
Payer-level denial trends and aging totals let the team target the specific payers and rejection reasons costing the most revenue.
~60% less spreadsheet work
Charge tracking, status, and history all live in the system of record instead of a manually maintained Excel file.
Clear, shared record of every claim
Status history and comments gave the team and leadership one consistent account of where a claim stood and why.
The system of record has to include the workflow, not just the data
Holding the billing data wasn't enough without the workflow too, and that gap is exactly what Excel filled by default. Bringing the workflow into the same system removed the reason for a shadow tool to exist.
Aging is the single most useful lens for triage
Of every way to slice the charge list, bucketing by days outstanding did the most to change behavior, making the highest-risk work visible by default instead of requiring someone to go looking for it.
The pain point behind analytics was as urgent as charge tracking's
The dashboard wasn't in the original scope, but leadership couldn't see why 80% of claims were stuck, any more than the AR team could act on them. Same visibility problem, different level. Treating analytics as a real module, not a bolted-on report, is what made it the biggest lever on the recovery number.